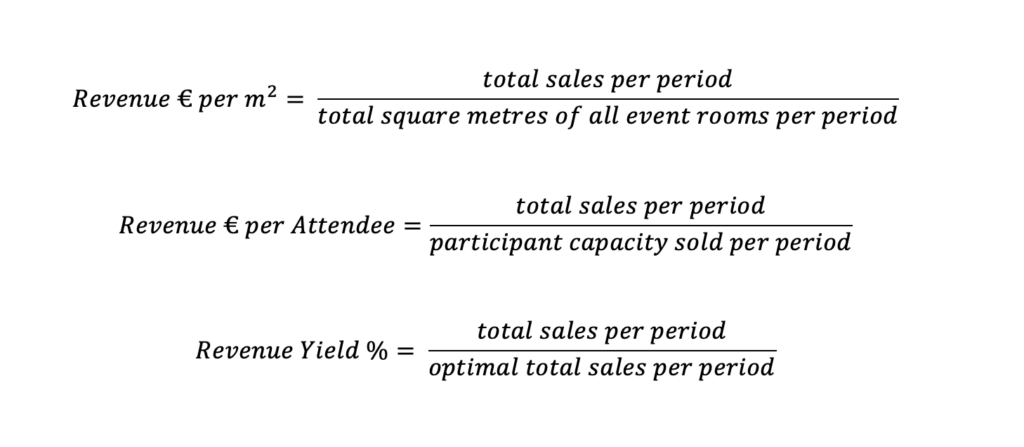
In addition to the effectiveness of events, sales are also important key figures in MICE revenue management so that the following questions can be answered:
- What is the revenue per available square metre (RevPASM)?
- What is the revenue per attendee (Revenue per Attendee)?
- And what is the percentage of revenue generated compared to the optimum total revenue for the designated event rooms (revenue yield)?
The basis for the revenue yield and the RevPASM are the defined optimum capacities.

There is a relationship between the above metrics and demand, so space utilisation must be analysed for each individual day and according to weekday patterns. The findings support the venue in forecasting and reviewing its strategy.
Compared to hotel rooms, however, the evaluation of event spaces is far more difficult. An event space can be used several times a day, in different combinations with different event types and revenue streams (McGuire/Wood, 2016, p.361).
The revenue for an event with 30 participants at EUR 55.00 per conference package is EUR 1,650.00 compared to the revenue that the venue generates with a pure room rental of EUR 900.00. However, if the venue takes the costs into account in this comparison, the profit for the pure rental of the event space is significantly higher.
The complexity of function space revenue management makes daily manual recording almost impossible. It requires automation of the function space process and the use of revenue management technology. However, venues should not shy away from this and start implementing and analysing key figures for this area in small steps.
Conversion Rate
The conversion rate shows the proportion of enquiries that were converted into definitive bookings.
This key figure can be recorded by arrival date and creation date. It provides key information on the performance of the venue, helps to recognise potential in Group Convention Sales and to improve processes.
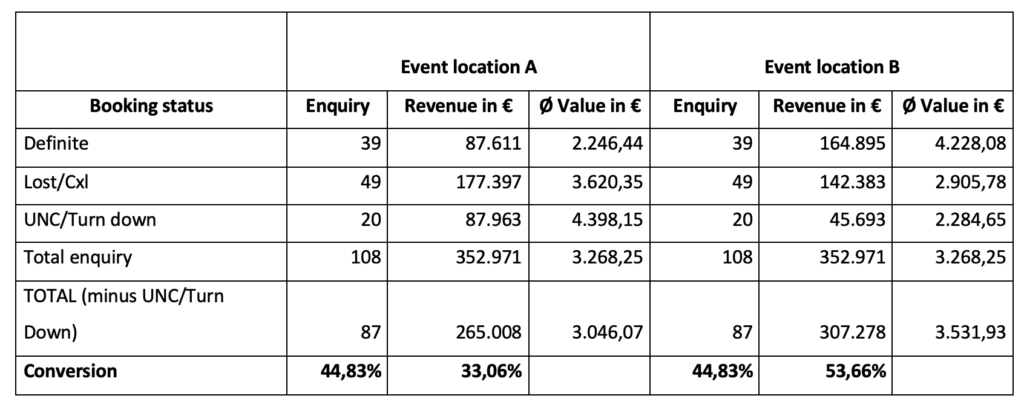
The conversion rate is often only recorded for the number of bookings and the materialisation of sales from enquiries is not taken into account. The example in Table 15 shows two event locations with the same number of enquiries and a conversion rate of 44.83% in the period under review. Location B was able to materialise enquiries with a higher average value and therefore more than 50% of the requested turnover. It worked more effectively. Location A had to turn down higher-value enquiries as there was no more event capacity available.

Fig. calculation of the conversion rate; source: own illustration
According to the motto “first come, first serve”, event locations block capacities and may therefore exclude higher-value business at a later time of enquiry.
This example shows that it is not necessarily necessary to increase demand in order to achieve an increase in turnover. With knowledge of demand and the pace of bookings, a location can select higher-value business more effectively and maximise the result.


